| FY2013 | FY2014 | FY2015 | FY2016 | FY2017 | ||
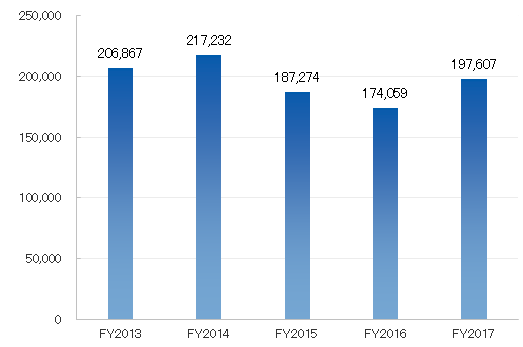
| Net Sales (Yen m) | Term End | 206,867 | 217,232 | 187,274 | 174,059 | 197,607 |
|---|---|---|---|---|---|---|
| Operating income (Yen m) | Term End | 3,888 | 5,056 | 3,450 | 3,698 | 4,806 |
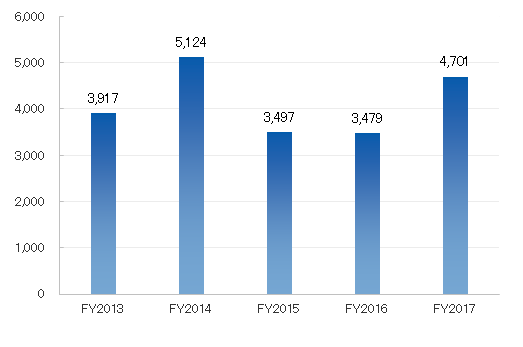
| Ordinary income (Yen m) | Term End | 3,917 | 5,124 | 3,497 | 3,479 | 4,701 |
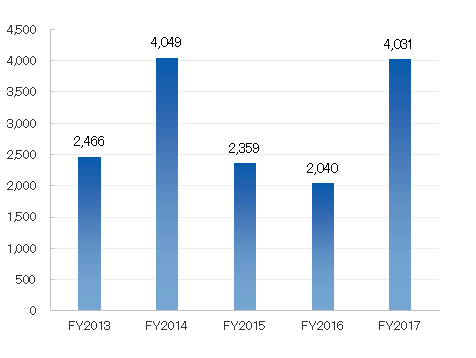
Profit attributable to owners of parent(Yen m) |
Term End | 2,466 | 4,049 | 2,359 | 2,040 | 4,031 |
| Comprehensive income (Yen m) | Term End | 2,654 | 4,349 | 2,328 | 2,559 | 5,043 |
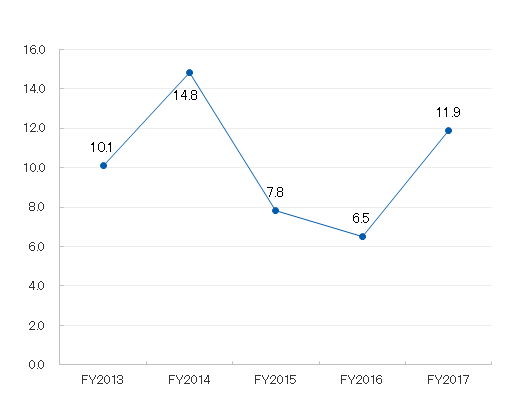
| Return on Equity (%) | Term End | 10.1 | 14.8 | 7.8 | 6.5 | 11.9 |
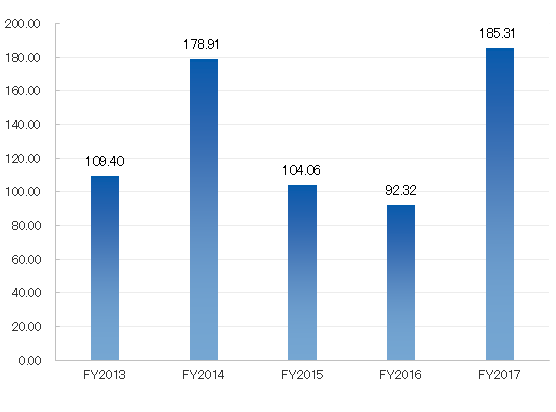
| Net income per share (Yen) | Term End | 109.40 | 178.91 | 104.06 | 92.32 | 185.31 |
| Dividend per share (Yen) | Term End | 24.75 | 28.50 | 30.00 | 35.00 | 40.00 (plan) |
| FY2013 | FY2014 | FY2015 | FY2016 | FY2017 | ||
| Total assets (Yen m) | Term End | 53,879 | 59,893 | 56,793 | 61,337 | 75,323 |
|---|---|---|---|---|---|---|
| Net assets (Yen m) | Term End | 25,694 | 29,580 | 31,355 | 32,311 | 36,398 |
| FY2013 | FY2014 | FY2015 | FY2016 | FY2017 | ||
| Consolidated (People) | Term End | 972 | 933 | 883 | 843 | 964 |
|---|---|---|---|---|---|---|
(millions of yen)
(millions of yen)
(millions of yen)
(%)
(yen)
